Snoopi, aka Prints, in his hoodie.
Snoopi, aka Prints, will “sniff” out data of people around him through a wearable hoodie controller that he will wear and display the information on a LED screen attached to the hoodie. This real time data and collected data would also be visualized in the “dog house” on a computer nearby.
As a group, we have thought a lot about the way our data is collected on an everyday basis, with and without our knowledge. We are interested in exploring this topic and spotlighting this issue to people who may be unaware. Culturally we are at a place where the ramifications of having this data shouted out over wireless network has largely remained unseen. With Snoopi we want to start the conversation surrounding simple, benevolent acts (such as petting a dog) and data collection and profiling. Also we like puns.
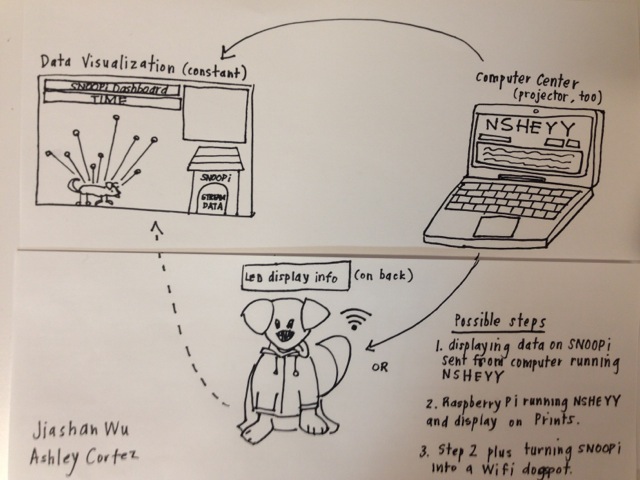
System diagram
Sniffing Program
We are using N.S.Heyy, created by Surya Mattu, to pick up wifi signals from nearby mobile devices. This allows us to capture unique mac addresses and their corresponding wifi router connection history and their distance to the program (through signal power).

N.S.Heyy sniffs out WiFi probing signals from devices. Screenshot of the interface.
Snoopi Hoodie Display
Prints will be wearing a hoodie controller with a LED screen attached on the back to display scrolling router history information. The LED screen would either be programmed by an Arduino which is connected to Bluetooth through BlueFruit or a mini computer such as the Raspberry Pi or Android device. The LED screen will display the information when the hoodie is up and not display anything when the hoodie is down. This would be done with conductive material sew on the hoodie to create an on/off switch.
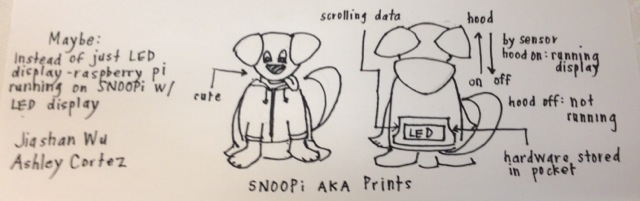
Hoodie diagram
Data Visualization (dog house)
The data visualization is a Processing sketch that would run on a nearby computer. It would display the people/devices around Prince in real time. Viewer would be able to click on each to reveal their router history. The dominant router names sniffed from the area would also be displayed in the corner of the visualization.

Dog house data visualization sketch
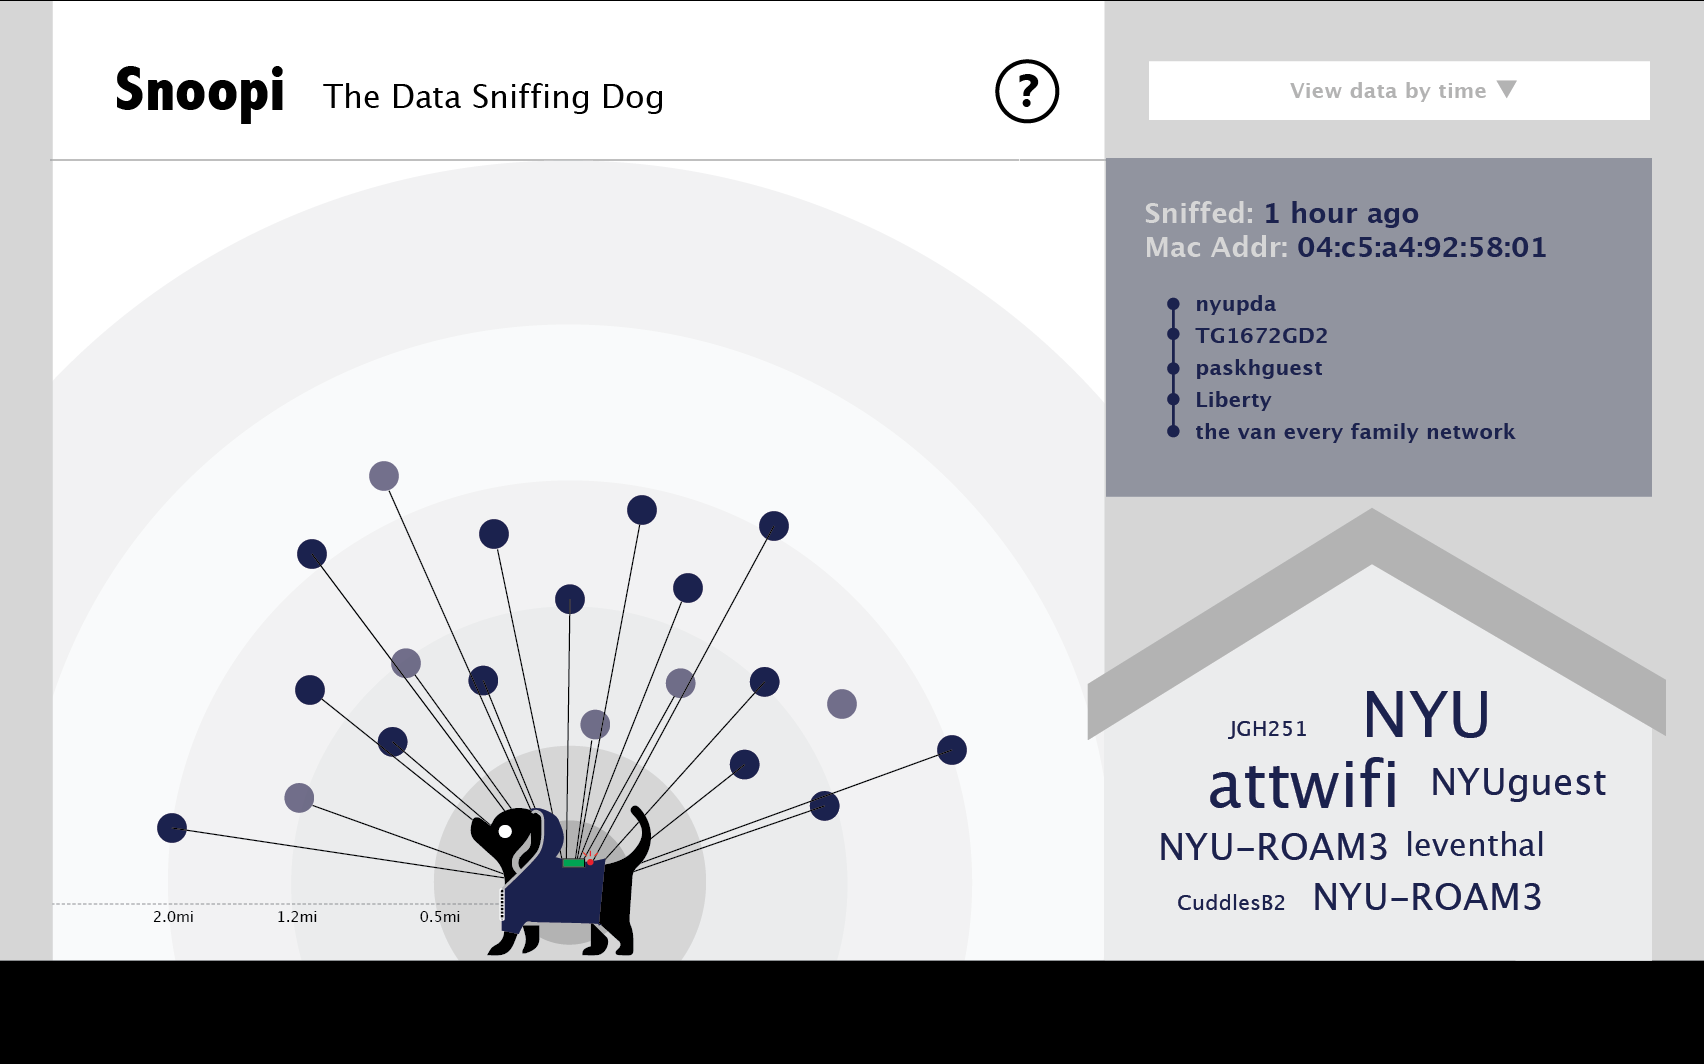
Data visualization rough mockup
Wireframe: Setup the data structure. Getting the data to display in real time.
Progress
- Sniffing program: the program is running smoothly and updates in a spreadsheet that can be loaded line by line into the Processing sketch
- Hoodie: we have the Arduino setup with the Bluefruit and the LED screen. We can send messages from the Arduino IDE to be displayed on the LED screen. This is operating fully off of a 9V battery
- Hoodie: we have a black hoodie! have prototyped it with Prints.
- Data vis: we have the data structure setup drawn out and have started on a rough version of the layout
- Prints: we are training Prints to get into a bag so he can also sneak in like a bandit

Testing LED screen with Arduino and Bluefruit. It works!
To dos
- Ordering materials
- Hoodie: prototyping the on/off switch
- Hoodie: getting the Processing sketch to send strings to Arduino IDE and the Arduino IDE to send strings to the LED display
- Hoodie: trying out mini computer option
- Data vis: finalizing design and completing code
- Testing: testing it on Prints around people!
General Questions
- How revealing is the data visualization? With a few devices we were able to pick up lots of router history, and was even able to google map them out to get a pretty clear idea of who the person is and where he has been. But this kind of detail is rare and even with the rare cases, the visualization itself wouldn’t be able to reveal much without manually google searching router names.
- Will people be able to see the LED screen?
Technical Questions
- Where should we place the program? The ideal would be on Prints, so that he would be the center point from where the data would be collected and where their distance would be measured from.
- Alternatively, we can also leave the program on the computer, where the data visualization would be displayed, and send the router names to the LED screen on Prints to be displayed. How would we get the Processing sketch to send strings to the Arduino IDE that would in turn send the strings to the Arduino and LED screen?
- How to get real-time data/string information to upload and display from Processing to Arduino and then to the LED display on Prints?
- Can NSHEYY operate on the Raspberry Pi?
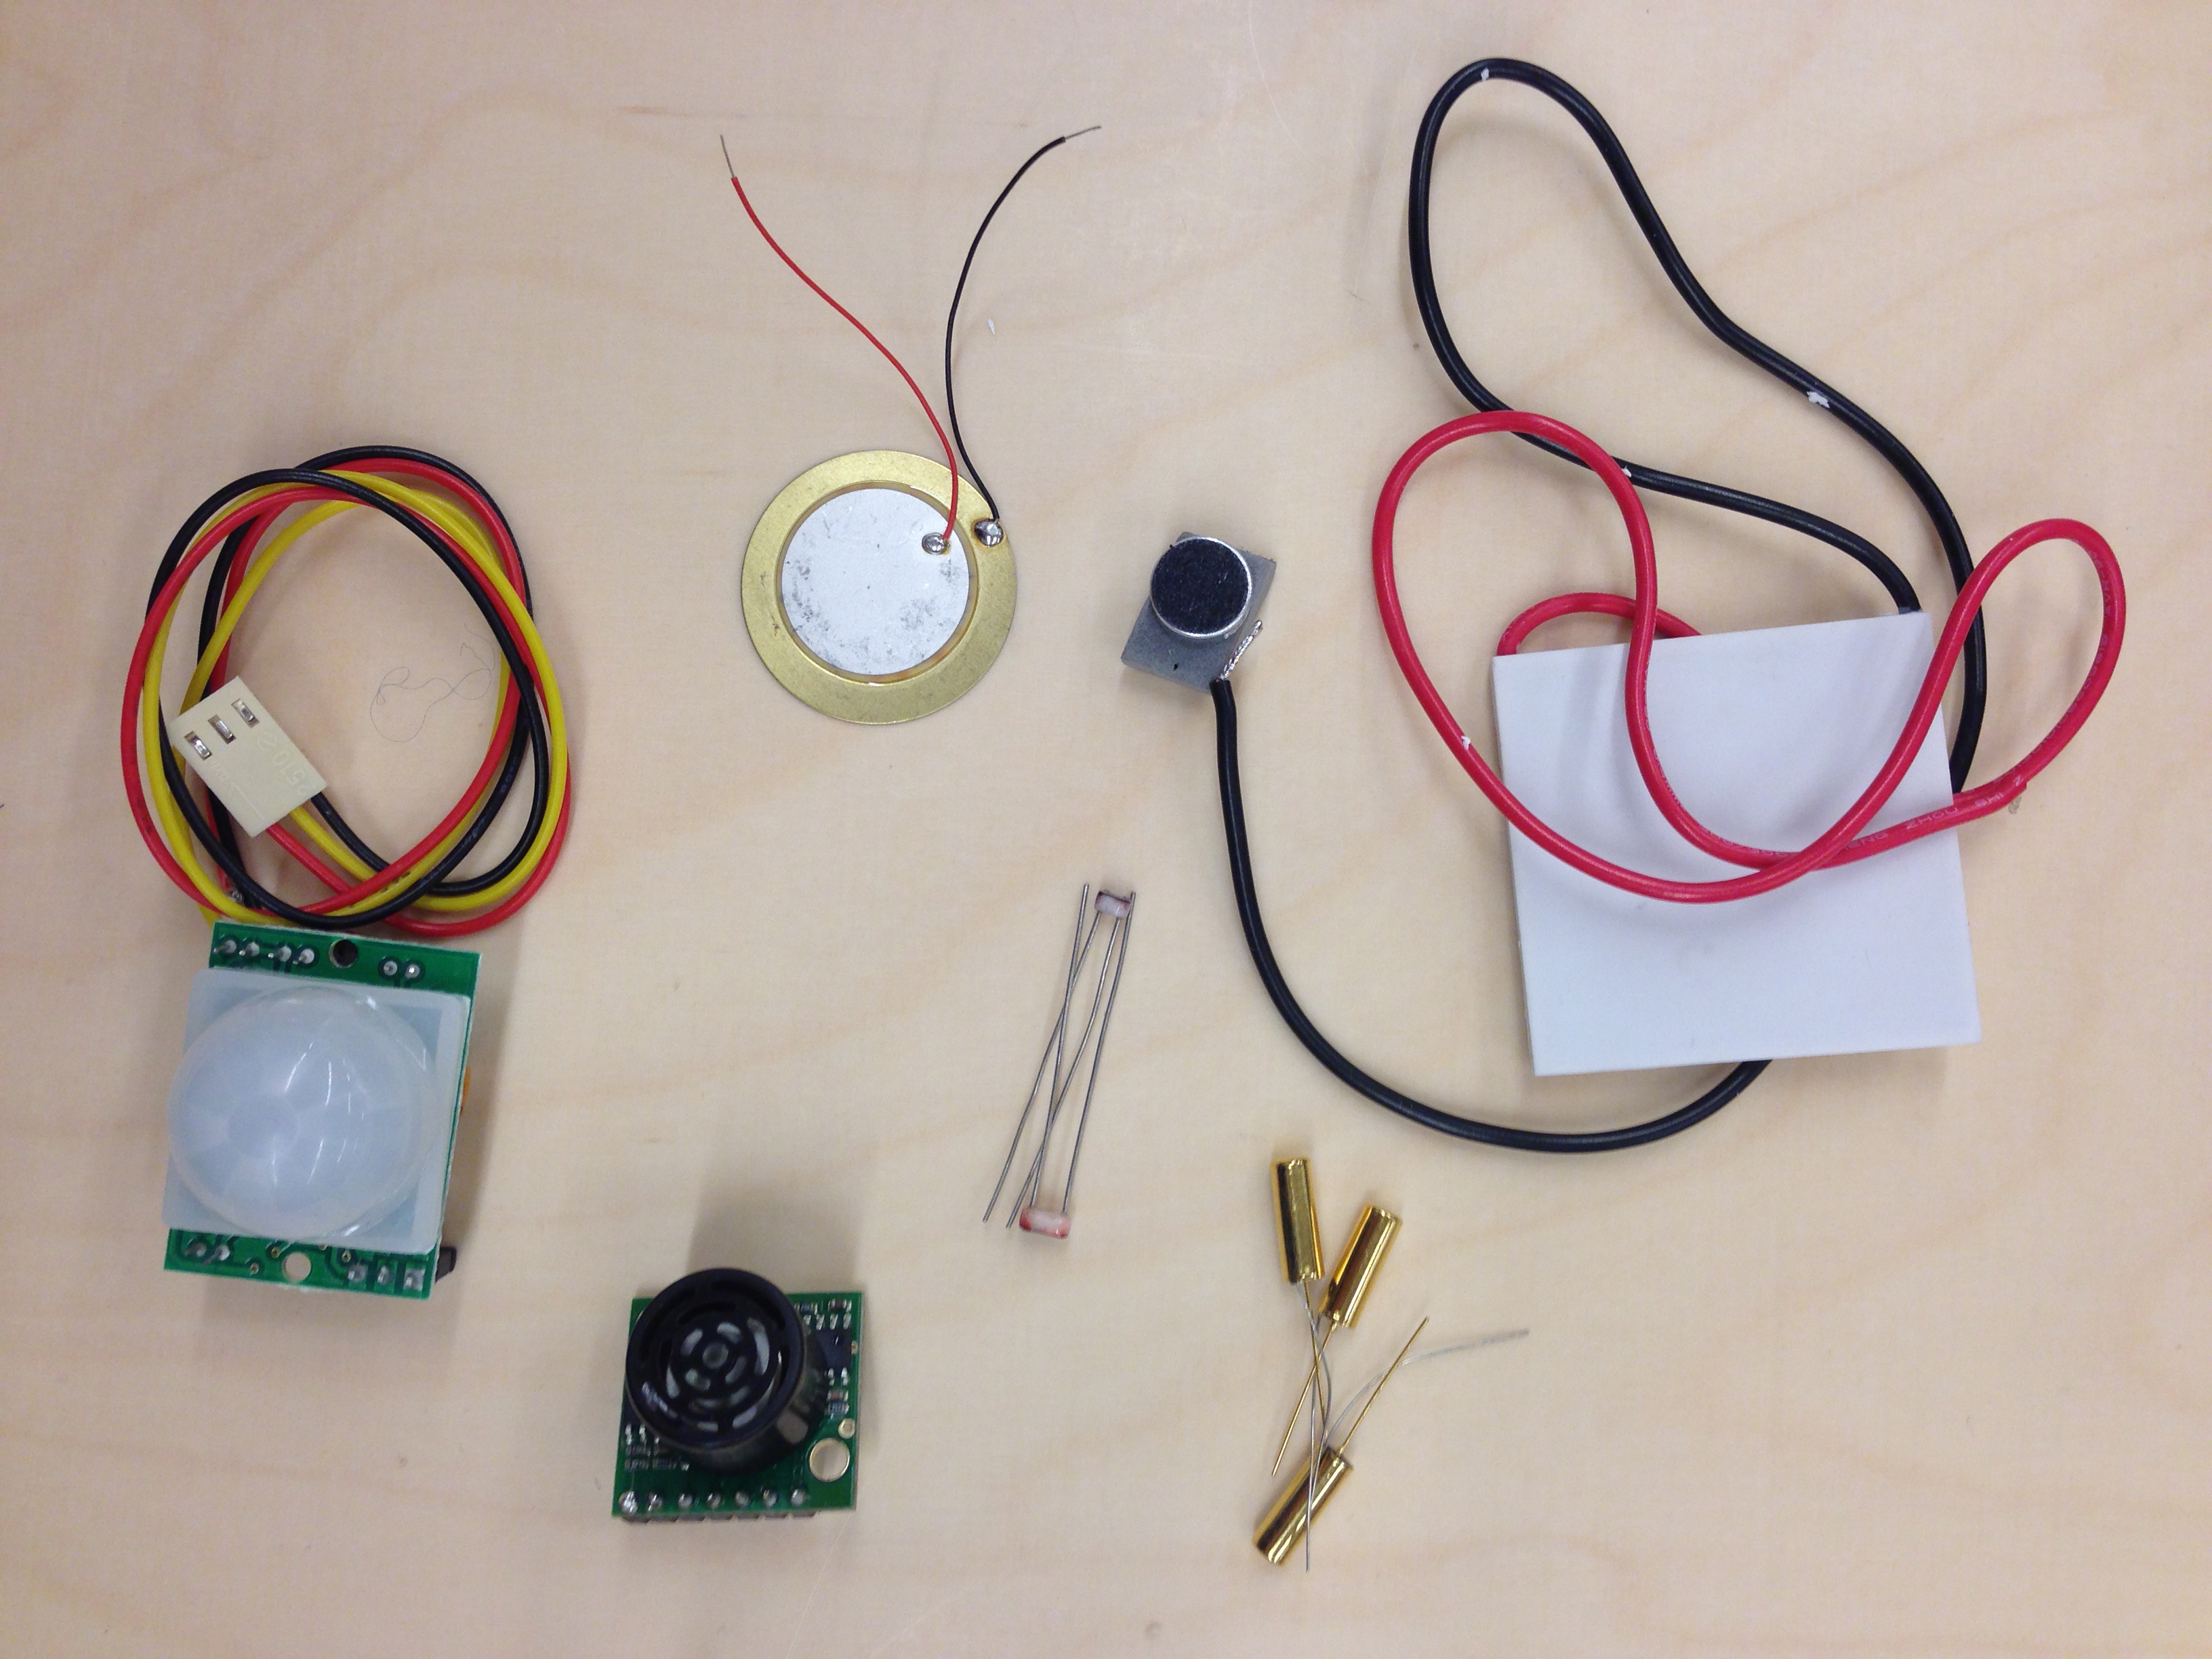
[Bill of Materials here]